Wildfire Risk in a Warming World
Executive Summary
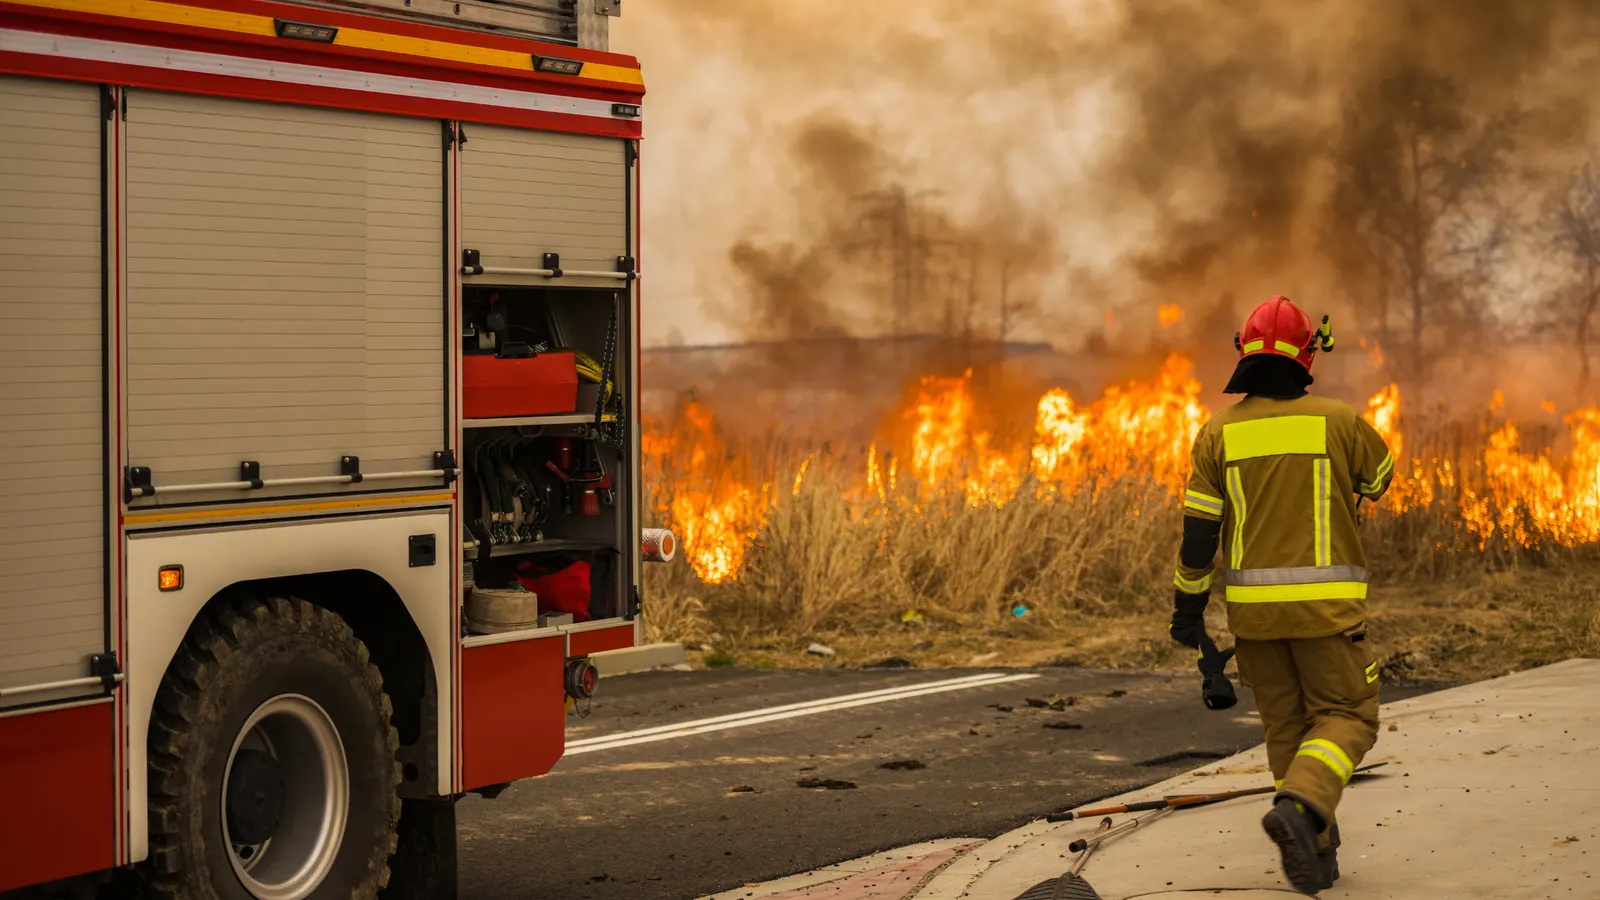
Wildfires are intensifying in frequency, severity, and economic impact across the globe, but especially within the United States. From densely populated regions of California to the vulnerable coastlines of Hawaii, recent megafires highlight the convergence of poor planning, climate volatility, and aging infrastructure. This report outlines wildfire trends from 2015 to 2025, presents data on major U.S. and international fire events, and applies a HARC (Hazard Analysis and Risk Control) framework to inform urban planning and building resilience. Key takeaways
- The escalation is driven by four converging factors, not one: a century of fire suppression building fuel loads, the worst megadrought in 1,200 years, utility infrastructure as an ignition source, and 49 million homes built into the wildland-urban interface.
- Acreage is a poor predictor of death toll. Lahaina burned 2,170 acres and killed 101 people; the Dixie Fire burned 963,000 acres and killed one.
- Power lines are the single most addressable cause. PG&E equipment alone ignited the 2018 Camp Fire and the 2021 Dixie Fire, and the fix, undergrounding and smart shutoff, is known.
- Roughly 85% of US wildfires are human-caused, and fire seasons have lengthened by 70 or more days since the 1970s.
- The controls that work are planning controls: zoning, defensible space, Class A fire-rated construction, and evacuation capacity designed before the fire, not during it.
Wildfire Trends: U.S. and Global Overview
Between 2014 and 2023, the U.S. averaged 62,277 wildfires per year, consuming approximately 7.02 million acres annually. Suppression costs alone average $2 to $3 billion per year, while total damages can exceed $20 to $50 billion annually. Over 129,000 structures have been lost to wildfires since 2005. Approximately 85% of wildfires are human-caused.
Globally, extreme wildfires have doubled in frequency and intensity over the past two decades. Notable international events include Australia's Black Summer (2019 to 2020), Canadian wildfires (2023), and increasing Amazon forest burns.
Major U.S. Wildfire Events (2014 to 2025)
The following highlights major incidents from the past decade.
Camp Fire (November 2018, Butte County, CA): 153,336 acres burned, 18,804 structures lost, 85 deaths, $16.5 billion in damages. Caused by power lines.
2020 California Fire Season: 4.3 million acres burned statewide, approximately 10,000 structures lost, 33 deaths, over $12 billion in damages.
Dixie Fire (July to October 2021, Northern CA): 963,000 acres burned, 1,329 structures lost, 1 death, $1.15 billion plus $637 million in suppression costs. Caused by power lines.
Lahaina Fire (August 2023, Maui, HI): 2,170 acres burned, 2,200 structures lost, 101 deaths, $5.5 to $6 billion in damages. Caused by utility line ignition, hurricane-induced winds, and drought.
Southern California Wildfires (January 2025, LA County): 57,636 acres burned, approximately 18,189 structures lost, 30 deaths, $50 billion in total damages. Driven by Santa Ana winds.
Case Study: Lahaina Fire, Maui (2023)
The Lahaina fire illustrates how even a relatively small fire in terms of acreage can become one of the deadliest in U.S. history when it strikes a densely populated, poorly prepared coastal town. Despite burning only 2,170 acres, 101 people died. Key failures included no activation of emergency sirens, delayed water access for fire suppression, and evacuation bottlenecks due to poor urban layout. High winds from a distant hurricane and overgrown invasive grasses accelerated spread beyond containment capacity.
This fire serves as a stark reminder that wildfire preparedness must include not just forest management, but also urban design, communication redundancy, and utility hardening, especially in areas previously considered low-risk.
Why the U.S. Faces More Extreme Wildfires
No single cause explains the escalation. Four pressures compound: fuel that a century of suppression left standing, moisture that a 1,200-year drought removed, ignition sources the grid supplies, and houses built where the fuel is.
Ecological Fuel Loads: Western U.S. vegetation includes flammable species such as chaparral, pine, fir, and invasive grasses. Forests are overstocked due to a century of fire suppression, increasing fuel for crown fires. Crown fires spread through the canopy of trees, produce intense heat, and are extremely difficult to control.
Climate Pressure and Megadrought: The western U.S. is experiencing the worst drought in 1,200 years, reducing fuel moisture and increasing fire probability. Snowmelt occurs earlier and rainfall later, lengthening fire seasons by 70 or more days since the 1970s.
Infrastructure Ignitions: Overhead power lines are frequent ignition points. Equipment owned by Pacific Gas and Electric alone has caused dozens of fires, including the 2018 Camp Fire and the 2021 Dixie Fire. Lack of smart shutoff protocols or underground cabling in dry, wind-prone areas makes the grid a major hazard.
Wildland-Urban Interface (WUI): Over 49 million homes in the U.S. are now located in WUI zones, areas where residential development directly borders or intermixes with undeveloped wildland vegetation. Many of these homes use flammable materials and lack proper defensible space or landscaping buffers.
HARC Matrix: Wildfire Urban Planning Hazards
The HARC (Hazard Analysis and Risk Control) framework identifies hazardous conditions, estimates initial risk using a Likelihood (1 to 5) multiplied by Severity (1 to 5) formula, and introduces control measures to reduce risk.
Building in WUI: Initial risk 20 (Likelihood 4, Severity 5). Controls: zoning laws, fire-resistant materials, defensible space. Residual risk 6.
Invasive Grasses: Initial risk 20 (Likelihood 5, Severity 4). Controls: prescribed burns, grazing, invasive removal. Residual risk 6.
Overhead Power Lines: Initial risk 20 (Likelihood 4, Severity 5). Controls: undergrounding, shutoff switches, inspection. Residual risk 6.
Drought-Stressed Trees: Initial risk 20 (Likelihood 5, Severity 4). Controls: tree removal, pruning, buffer zones. Residual risk 6.
With improved engineering controls, government-funded infrastructure improvements, and a return to prescribed burning, the associated initial risks can be significantly reduced.
Recommendations
Every recommendation below is a decision made before a fire starts. Once ignition happens in a wind-driven megadrought, response capacity is largely fixed, so the leverage sits in zoning, construction standards, and grid hardening.
1. Urban Planning Overhaul: Restrict development in high-risk fire zones through stricter zoning regulations. Mandate fire-adapted community planning including clear evacuation routes, fire breaks, and buffer zones. Require fire risk modeling before development permits are approved.
2. Grid Modernization: Underground utility lines in fire-prone areas or use smart shutoff systems. Increase vegetation clearance around transmission corridors. Integrate grid sensors and AI-based risk mapping to forecast failure points.
3. Vegetation and Land Management: Expand prescribed burn programs with Indigenous consultation. Invest in fuel removal and invasive species eradication. Restore native vegetation to reduce fire ladder fuels.
4. Resilient Construction Standards: Mandate Class A fire-rated materials for roofing, siding, windows, and decks. Require ember-resistant vents and hardened landscaping. Retrofit existing structures in high-risk zones.
5. Public Readiness and Evacuation Planning: Fund community outreach and multilingual preparedness campaigns. Install redundant emergency alert systems including sirens, push notifications, and radio overrides. Run annual evacuation drills in high-risk areas.
6. Federal Coordination and Climate Adaptation: Integrate fire resilience into climate adaptation plans at federal, state, and municipal levels. Expand pre-disaster mitigation grants tied to proactive fire safety measures. Develop national wildfire risk maps updated annually using satellite and AI data.
Frequently Asked Questions
Q: Why are U.S. wildfires becoming more destructive and expensive?
The escalation is driven by four converging factors: decades of fire suppression allowing fuel loads to accumulate, a 1,200-year megadrought reducing vegetation moisture, rapid expansion of homes into wildland-urban interface zones, and aging utility infrastructure that frequently ignites fires. The 2025 Southern California fires alone caused an estimated $50 billion in combined damages.
Q: What caused the Lahaina fire to be so deadly despite burning only 2,170 acres?
The Lahaina fire's death toll of 101 resulted from a combination of factors: emergency sirens were never activated, water supply was delayed, evacuation routes were bottlenecked by poor urban layout, and hurricane-driven winds accelerated spread beyond containment. It demonstrated that wildfire lethality is determined as much by emergency preparedness as by fire scale.
Q: What is the HARC framework and how does it apply to wildfire planning?
HARC stands for Hazard Analysis and Risk Control. Applied to wildfire urban planning, it identifies specific hazards, scores their initial risk by multiplying likelihood and severity, then calculates residual risk after controls are applied. The framework helps planners prioritize interventions with the highest risk-reduction impact.
Q: How does the wildland-urban interface contribute to wildfire risk?
WUI zones concentrate both ignition sources and structural fuel in the same geography. Over 49 million U.S. homes now sit in WUI zones, where a single ember storm can ignite dozens of structures simultaneously, overwhelm local fire suppression resources, and trap residents in inadequate evacuation corridors.
Q: What role do power lines play in starting wildfires?
Overhead power lines are one of the leading ignition sources for large wildfires in the western U.S. Pacific Gas and Electric equipment has been linked to the 2018 Camp Fire and the 2021 Dixie Fire. Solutions include undergrounding lines in high-risk corridors, AI-based grid monitoring, and public safety power shutoff protocols during extreme wind events.
Does your technology address wildfire risk, grid resilience, or infrastructure safety? Pivot Global Solutions helps energy and infrastructure technology companies navigate cross-border market entry, connecting innovative solutions with the markets that need them most.
Related: For satellite and AI-based wildfire detection and spread prediction, see FireWatch™ on the Space-Eyes Japan page.
Weighing a border? Start with a conversation.
Whether you are weighing a new market or already committed, we will give you a straight, honest read on the opportunity and how we can help.